The rapid rise of the questions & answers site, driven by the past decade’s Internet boom, has brought with it promises of more participatory governance, new online dynamics and an opportunity for users to absorb and share knowledge across the frontiers.
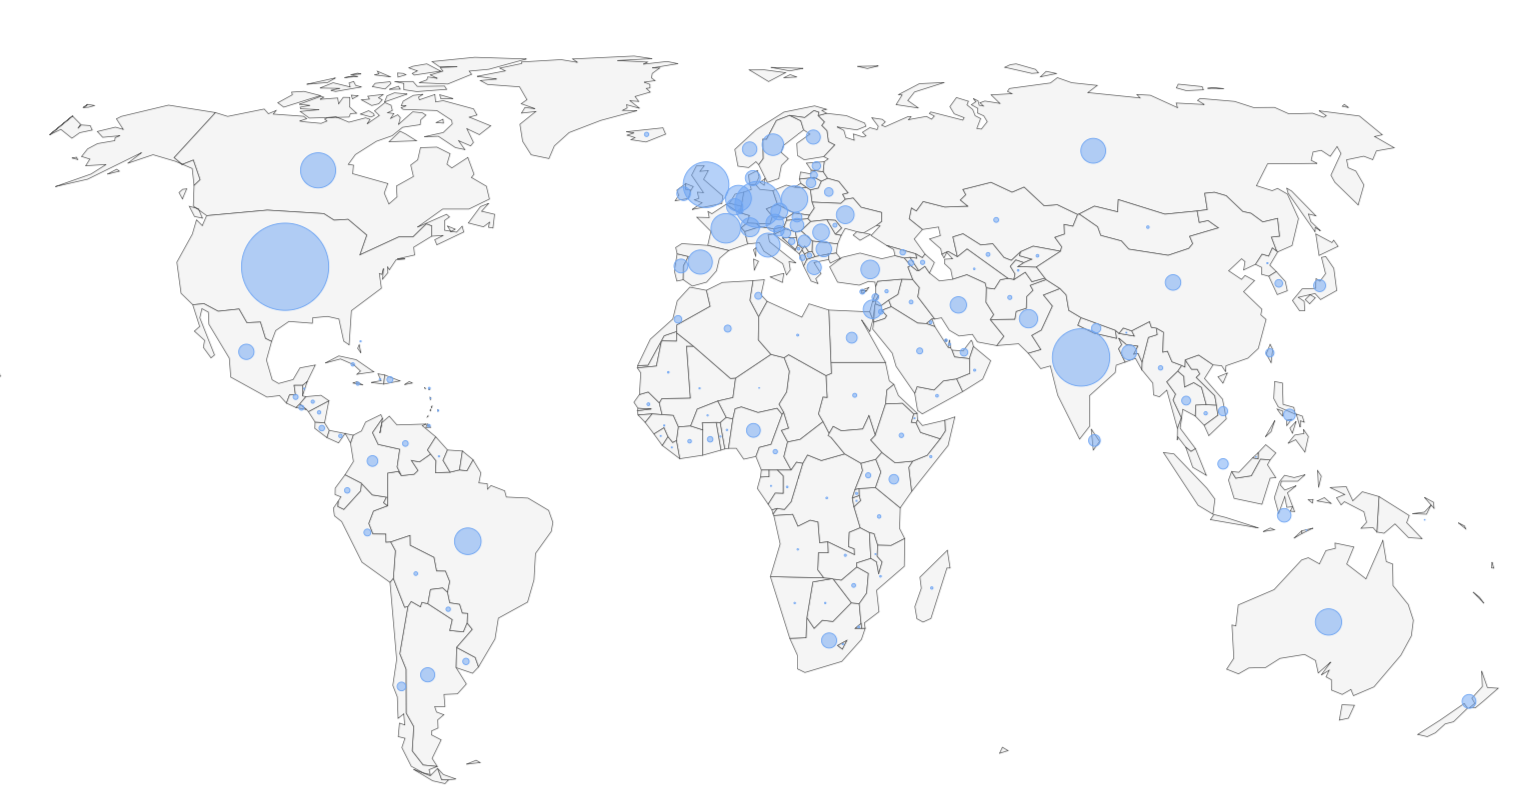
Stack Overflow is arguably the most popular questions & answers site in the world of programmers, as highlighted in the following figure, in which a map visualizing the Stack Overflowers around the globe has resulted in a new outline of the world. As such, this data story focuses on the Stack Overflow user community around the world, the various characteristics of users in different regions, and finally, the connection and interaction built upon this platform.
Goal
Our project aims to study the characteristics of the user interaction on Stack Overflow. How and when are users from all over the world using Stack Overflow? Are there any noticeable programmer communities on Stack Overflow? This project tries to answer these questions and to understand more about the community facilitated by Stack Overflow.
Dataset
We used the following datasets.
- Stack Overflow Annual Developer Survey (link): They ask questions like: Do you code as a hobby, Are you currently enrolled in a formal, degree-granting college or university program and many other kinds of questions. The respondents were recruited through onsite messaging, blog posts, email lists, meta posts, banner ads, and social media posts. According to the documentation, highly engaged users on Stack Overflow were more likely to notice the links for the survey and click to begin it. The dataset is in CSV format and about 50 - 200MB per year.
- Stack Overflow Data from Google BigQuery (link):
The dataset is hosted in Google BigQuery, and it has data from users, posts, comments, tags, votes, and badges from 2008 to 2019.
- Users data - with information such as their country of residence, user id, name, account creation date, etc. (for geographical analysis, we only make use of the users that contains a valid country field)
- Questions - questions from 2016 to 2019, with information like question id, answer count, creation time, score (upvote), owner user id, etc.
- Answers - answers from 2016 to 2019, with information like answer id, creation time, parent (question) id, score (upvote), owner user id, etc.
- World Bank Open Data / UN Data / Kaggle World Bank: A variety of statistical resources are used to provide background information for the machine learning part of our analysis.
Interesting Findings
Here are some of the interesting insights. We categorized them into three sections, user, time and country related.
- Visit frequency on Stack Overflow is correlated to job satisfaction.
- Super active users has been carrying us on Stack Overflow.
- Potential experience influence on participation rate.
-
The 6 most important programmer archetypes and their respective language portfolios.
- Noticeable portion of unanswered questions per year.
- Stack Overflow participation is more active on weekdays than on weekends. A noticeable drop in the participation rate is also observed in Christmas and new year.
-
User participation rate is quite even in working hours and non-working hours.
- Developing countries have a higher active rate than others on Stack Overflow.
- Global information flow is faciliated through Stack Overflow.
- The programmer type distribution varies around the world (based on our archetypes).
More Stack Overflow, better job success?
To get the most basic idea of how do people use Stack Overflow, let’s plot the visit frequency distribution of the survey respondents. We see that most people answering the survey use Stack Overflow quite often. This may, of course, be due to the sample being somewhat skewed since active Stack Overflow users are probably more inclined to answer the survey.
It is interesting to see how does the activity on Stack Overflow correlates with job satisfaction and the average salary of the users. From the following figure, we can see that job satisfaction increases actually quite clearly with more time spent in Stack Overflow. Maybe it’s a good idea to search for the answers instead of trying too hard to solve all problems by yourself.
We are carried by super contributors
When searching for solutions on Stack Overflow, have you ever wonder who is providing the answers that you are looking for?
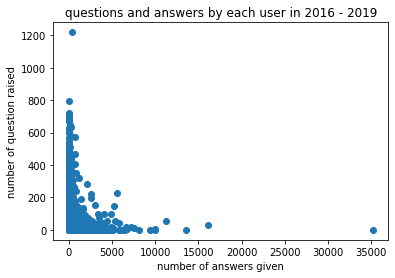
We analyze the number of questions and answers from 2016 to Sep 2019 and group them by unique user id.
As we can see, both the number of questions and answers given by users of Stack Overflow roughly follows a power-law distribution. Although a general user only asks a few questions / provides a few answers, some users contribute mainly to the question and answer pool.
There exists one person who asked over 1200 questions in the 4 year period, which is over one question per day. The phenomenon is even more apparent for the answer distribution, where there are people who gave more than 10000 answers over 4 years (around 6 / 7 answers per day), and one even provided 35219 solutions in 4 years (over 24 answers per day!!!). Us being only visitors of Stack Overflow, we are definitely “carried” by those significant contributors of the community.
Is experience a better teacher?
The number of questions and answers of each respective user from the year 2016 to Sep 2019 is isolated out and plotted in the graph below.
It seems like the two participation activities are inversely proportional to each other. The shape observed is probably due to the experience difference of users on Stack Overflow. Perhaps for more experienced users, they are more likely to answer questions from others. While for beginners or people first exposed to a new technology/framework, they are more likely to ask questions on the relevant topics, thus resulting in such a shape.
Another point of notice is that the majority of the users do not participate much (the dense blue area near the origin). Some people contribute a lot, but the joint contribution of small contributors is also relevant in creating the large community of Stack Overflow that we experience.
Stack Overflower in a nutshell
What about the professional lives of the users? To get a feel of the different technologies that Stack Overflow users have, the following plot shows the distribution of the language use, showing languages with at least 4000 users in the survey.
It seems like JavaScript is clearly the most used programming language, with 60% of survey respondents saying that they are using it. The proportion of users drops quite quickly for the less mainstream languages like Rust and Kotlin.
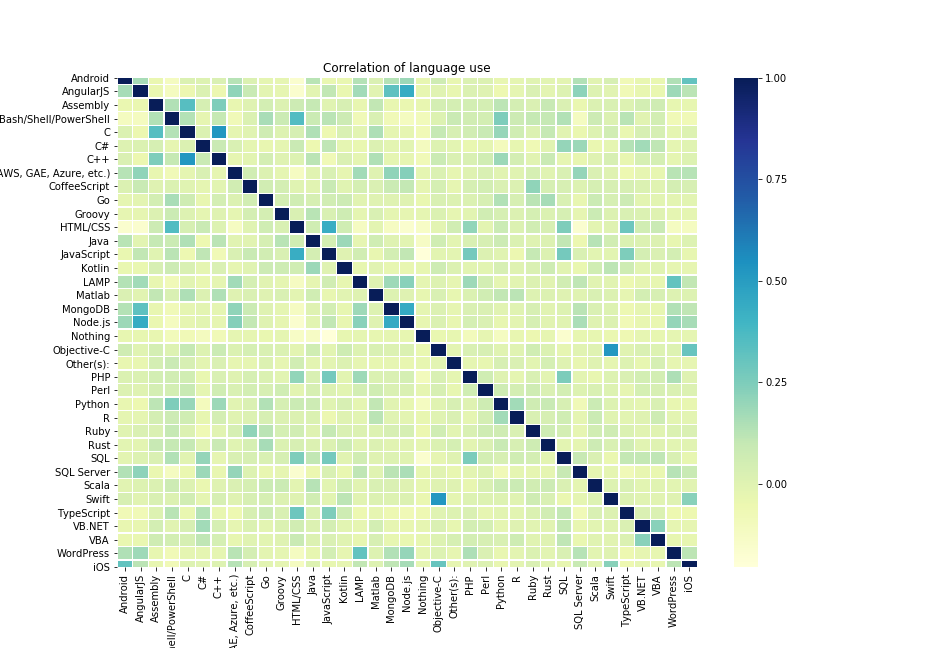
We thought that it is also interesting to see how are the languages correlated with each other. The figure below shows the correlation matrix between the same languages with at least 4000 users in the survey. Clear patterns emerge, like HTML/CSS being strongly correlated with JavaScript, both vital languages for web development, and Swift with Objective-C, which makes sense since both are used mainly to develop for Apple products.
To take the analysis further, we tried to do soft clustering on the users and their programming language use with non-negative matrix factorization. The idea was to extract automatically programmer “personas,” archetypes to which all programmers can be divided, with each programmer having a separate score for each persona. We decided on 6 clusters because that resulted in a good balance of interpretable results and keeping the amount types not too high.
The most essential features of the personas are plotted in the following figure (with logarithmic axes, hover the mouse over to see the actual values), where we can see the scores for how much is each programming language associated with each type. The types are actually quite possible to interpret intuitively, and we decided to label them as “Frontend Web,” “Python/Scripting,” “C#/General purpose,” “Java/App development,” “Backend Web” and “Low-level.”
We will come back to these “developer personas” in the third section, where we do a geographical analysis of their distribution, so keep them in mind.
Yet, Some Questions remain unnoticed…
The response rate to questions can be analyzed yearly.
It is interesting to see that even when the Stack Overflow community is seemingly very powerful and ‘knows’ everything, there is still a noticeable portion of around 15-20% of the questions posted on Stack Overflow each year, which does not receive any answers. They remain unnoticed in the sea of problems. The portion of questions receiving no answers is also increasing from 2016 to 2018 (the 2019 data is not accurate as the full-year data is not available by the time of the plot).
Noticeably, it is also rare for a single question to receive more than two answers, given there could often be multiple ways to achieve the final result.
Programmers also need to rest. :)
To get a feel of how the activity of the site changes daily, the plot below shows an example period showing the number of questions asked per day on Stack Overflow. Zoom by selecting an area of the plot to see more closely. We can see a pattern where the amount of questions decreases to almost half during the weekends and rises back again during working days quite reliably. It’s also interesting to note that the number of questions asked also drops to even lower amounts once a year during Christmas and New Year’s eve. No other seasonal event can be seen as clearly.
Do people work during working hours?
Another way to view the activity is to just look within one day. We can calculate the percentage of questions and answers being posted during working hours and free time. We decided to compare this percentage between users from different countries since it can give us an idea of which countries’ users prefer to use the site during work.
Questions
Answers
Note: We filtered out countries with less than 50k questions and 100k answers to focus on active countries. You can change the threshold by clicking the triangle button next to the # of Q/A. You can also do ascending sorting by clicking the “percentage” column header.
People from the Netherlands, France, and the United Kingdom seem to be the most active during working hours. The percentage of the Russian Federation is surprisingly low. This is because the way we decided if it’s in the working hours or not was by taking one of the time zones in the country and converting the UTC timestamp in the dataset into local time. Countries like Russia and the United States have multiple time zones, which causes our estimation to be inaccurate.
Spotting the bigger Stack Overflower
On a global level, the USA holds the biggest Stack Overflow user community and Sweden is the top country in terms of penetration as a percentage of the population.
Note: penetration is calculated as number of Stack Overflow user/ local population
Blank countries on the map are those having less than 500 users registered between 2016 and 2019. Their data are taken into account due to a high risk of bias.
On a regional level, we can recognize some patterns in terms of user activeness, the penetration of Stack Overflow, and the size of the user community. In particular, we observe from the Active User Ratio Map that developing countries tend to have a higher proportion of active users. We think this is due to the survivorship bias: People in these regions have limited access to computers and higher education, so the Stack Overflow users of these regions can be considered as Survivors. And a Survivor group tends to have higher activeness.
On the User Density Map, we could clearly recognize some regional patterns for the development of the IT industry.
- The well-known Nordic Tech, a powerful innovation engine in Europe
- Canada — A leader in ARTIFICIAL INTELLIGENCE
On a regional level, countries can be divided into several groups according to their rates of Stack Overflow penetration and the size of the user community. Some most distinct regional groups are the following:
-
The Giants: USA, India These two countries have a particularly large number of users, and their users provide a significant contribution to the Question & Answer activities on Stack Overflow.
-
Top Performers: Scandinavian countries, some Western European countries such as Switzerland, Netherlands along with Canada and Australia These countries have shown very high penetration rates in the survey, indicating a pervasive use of Stack Overflow in their groups of programmers. Despite their small country size, these countries all together demonstrate highly efficient and active use of Stack Overflow in their countries.
-
Emerging Countries: Mostly Asian countries, including Bangladesh, Pakistan, Iran, etc. These countries’ StackFlower user penetration rates are below the global average. But we can observe a highly emerging trend from their users, particularly active participation.
Furthermore, we observe that the number of questions and the number of answers of users are not always balanced in an area. On the local level, the answer question proportion could be very different from the global average. This phenomenon is widespread and seems to follow some geographical patterns. Do StackOverflow users’ preference between ask questions and propose answers follows a geographic distribution?
Which countries are more frequent questioners/answers?
We can see a clear global interaction pattern from the StackOverflow user’s behavior, which displays a global flux of programming knowledge.
Note: only countries with more than 500 new users between 2015 and 2019 are ploted
-
Normalised Question and Answer Count (‘Questions Per User Per Country’ & ‘Answers Per User Per Country’) The map becomes interesting when the raw count is normalized with the user number from each country. Users in Western Europe, like Germany, Austria, and Finland, are more active in answering questions. On a large scale, users in highly industrialized are more likely to use StackOverflow as a platform to spread their knowledge.
-
Experience Gap - Country View (‘Ques / Ans Per User Per Country’) A special scope of analysis can also be applied, as shown in the graph ‘Ques / Ans Per User Per Country.’ It shows the relative likelihood to ask a question than giving an answer. The higher the value is, the more likely for people in the country to ask questions on Stack Overflow. On the other hand, the lower the value is, the more likely for the users to provide answers from the country. From the map, we see users in third world countries tend to ask more questions than to answer questions.
These observations again highlight the human capital portfolio of the countries on computer science professionals. In countries with more computer science experts, like Germany, the United States, or Australia, people tend to answer more than actually asking themselves. While in countries that are developing their professionals, they tend to ask more questions along the way. This sheds some light on a new way of looking at Stack Overflow participation rates of different countries.
Where are all the Chinese programmers?
Machine learning of Stack Overflow users indicates an 800% potential user group increase in China. But the ban on Google slows down the use of Stack Overflow in China.
The data of Stack Overflow users reveal that the number of users of Stackoverflow in China is ranked 5th, thus between Germany and Canada, only 1/6 of the user amount of India. This is indeed a surprising result provided by the total population, the number of programmers, and the rapid rise of the internet industry in China. We wonder if there is a reason behind this.
We found out that Stack Overflow required external JavaScript from some other domain, including Google jQuery, which is blocked in China. The site itself is not blocked, so a Chinese user can view the content without a problem. But if the person wants to log in and ask & answer questions, the load of external JavaScript fails.
We decide to use a linear regression model to estimate the potential Chinese StackOverflow user number. We collect the following features for each country:
- Internet penetration rate
- Population
- GDP per capita
- Average English Level
- Number of universities ranked in global top 10000
The training data is the above 6 features of 160 countries (China excluded) with Stack Overflow user number as the dependent variable. After training our model and tuning the regularization constant, we obtain a prediction. With the prediction data, the amount of China’s Stack Overflowers would surpass the UK by far and catch up with India to become the third-largest user community.
From a global viewpoint, the size of question and answer data would have a considerable increase as well, which would be beneficial to the whole Stack Overflow community. We think this is a pity and hope the scenario could be ameliorated soon.
Knowledge transfer - who is the biggest’ exporter’ of knowledge?
The three major economic partners of the USA are Mexico, China, and Canada. But on StackOverflow, the US’s three major interaction partners are India, UK, and Germany.
Since Stack Overflow is a global community, it is not surprising to receive answers from the other side of the globe. The interaction between questions raised and answered in a different country is visualized in the following network graph.
Note: Only the top ten most active countries on Stack Overflow (in terms of the question and answer count) and Switzerland are included. Different countries of focus can be selected in the dropdown menu.
Note2: The direction of the arrow indicates the number of answers from the source node to questions from the destination nodes. Green links highlight the answers provided by the main focus country to the answers of the other countries.
Note3: A large portion of the answers in Stack Overflow actually have the same source and destination nodes (like US answering questions from the US), and also over 200 other countries participate on Stack Overflow. But to explore the interaction of different entities and visualization, only the top ten and Switzerland are shown.
From the graph, the interaction between different countries can be better visualized and observed. The activeness of countries like the United States and India can still be observed, but other countries also have noticeable contributions. Feel free to explore the network graph in different countries! :)
Programmer types and their place of residence
If you recall the programming language user personas from part 1, we decided to use them to see how are the different types of users distributed around the world by plotting the mean values of the scores of the users for each programming language and country. Only the countries with at least 500 people answering the survey are shown.
According to our interpretations, frontend development seems to be quite popular around the world, with Nigeria turning out to be the number one country. It is also quite popular in Sri Lanka, compared to most other places. The Python/Scripting category separates the countries quite a bit more, and the USA, along with Canada, Finland, China, and Chile, have some of the most active users. The C# category is, perhaps surprisingly, dominated by South Africa, while the scores for China and Nigeria are notably low.
The most active country doing Java and App development seems to be Sri Lanka, which leaves most countries actually far behind. Interestingly, there are quite significant differences even inside Europe, like Germany having quite a high score and Great Britain having a meager score. Indonesia, Sri Lanka, and Bangladesh are some of the countries where people have the most backend developers, and surprisingly the highest scores for low-level development come from Nepal and South Korea.
TL;DR There are a lot of things going on in the programming world.
We explored the vast community of Stack Overflow and found several interesting insights. Like visit frequency on Stack Overflow is correlated to job satisfaction, people enjoy their holiday and code less during Christmas, and developing countries have a higher active rate than others on Stack Overflow, just to name a few.
Thank you for reading such a long story!1
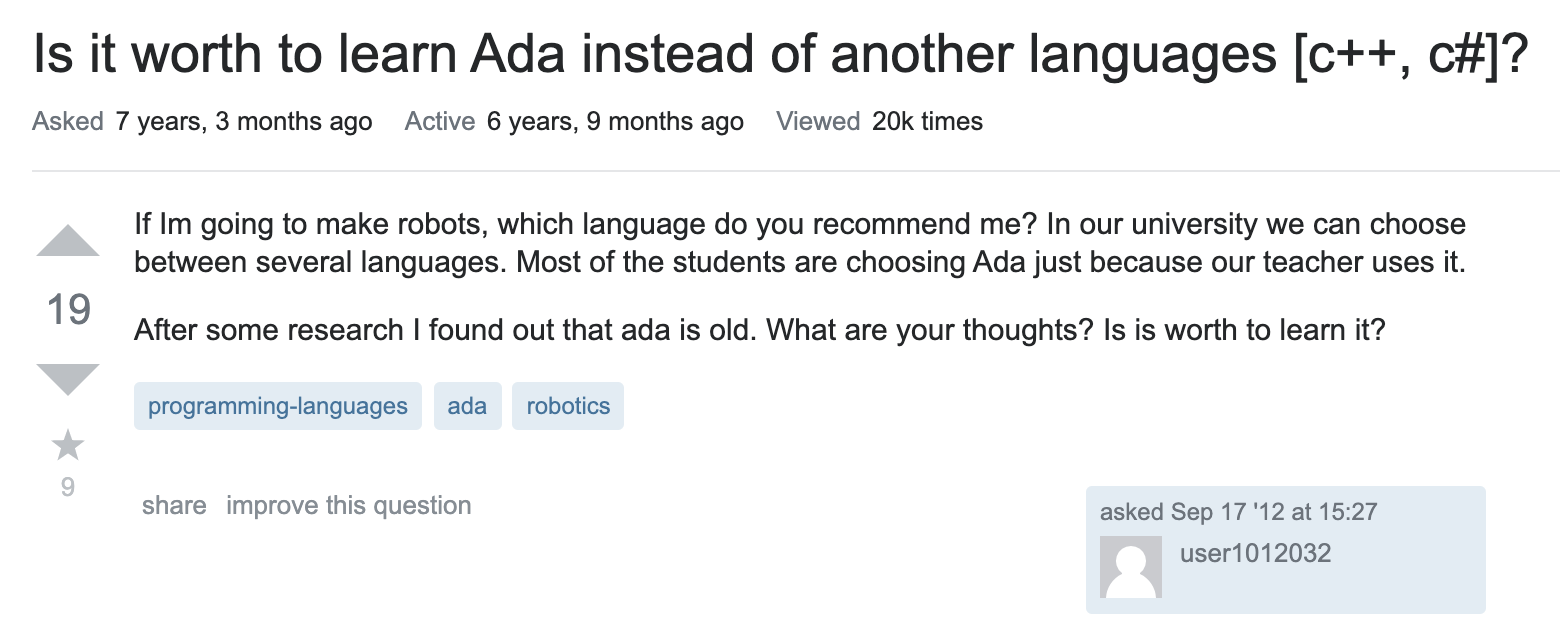
p.s. We found a question on Stack Overflow about ADA, and we believed the answer is YES.